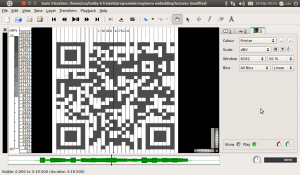
This little neat program creates audio spectra that are looking like an image that you can provide. A spectrum is the frequency representation of a signal, in this case the sound.
One day I found an article on hack-a-day, where the featured this one: http://hackaday.com/2011/05/26/hidden-messages-in-audio/
This made me want to be capable to create spectra like this easily. The first step to approach this was to produce simple spectra which have only one frequency component. Luckily there was already a software that did this for me. Based on that I finally wrote some functions to extend it and what you see here is the result of it.
Download the script at Github.
Short demonstration of the script:
When I give this (created by http://qrcode.kaywa.com) to my script:

I get an output file like this: output file
The spectrum of this (displayed by Sonic Visualizer) looks like this:

After some modifications of this screenshot using gimp I ended up with this image that can be decoded by all QR decoders I used:

The program basically produces short periods of 400 sine waves that are switched on or off for representing black and white pixels. Please have a look at the code before you ask questions. I will add some more comments on Tuesday probably. Please only use the communication provided by github – this makes it easier for me.
TODO (random order without priority):
- add support for greyscale images
- add parameters to define input and output file
- comment code
- rotate image depending on the needs for it (longer direction on time scale, shorter direction on frequency scale)

One Reply to “png2audioSpectrum”